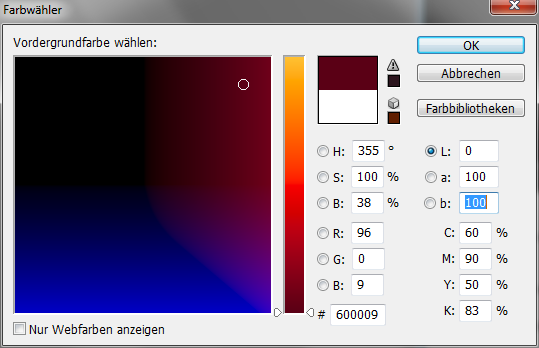
Softwareprogramme, die Lab-Farbe unterstützen, lassen auch Farbwerte wie z.B. Lab(0, 100, 100) zu. Das Beispiel wird üblicherweise als Dunkelrot angezeigt, ist aber völlig sinnlos, denn in der Realität kann kein Licht der Welt diese Lab-Farbwerte erzeugen. Mit anderen Worten: eine Helligkeit 0 kann keine anderen a;b Werte als 0 aufweisen, oder: „nachts sind alle Katzen grau“. In the article it is shown that only about 60% of the usual Lab coordinate space (0..100, -128..127;-128..127) consists of colours, the rest are Lab coordinates without colour correspondence.
It would be important to develop a suitable algorithm for non-colours that corrects incorrect Lab coordinates already during input (= projects them onto the envelope). This would greatly increase the comprehensibility and applicability of the CIELAB model. The task is solvable, because the projection of the non-colour coordinates onto the range of visible colours could be done in a similar way as the gamut mapping of out-of-gamut colours.
Which colours make up the CIELAB shell?
Die intensivsten Farbtöne, die wir kennen, sind die Regenbogenfarben. Dieses sogenannten „monochromatischen“ Farben weisen maximale Intensität in einem Wellenlängenbereich auf. Example: A remission maximum in the interval 570-590nm leads to the CIELAB values (2 degrees D50): Lab 55.91 8.58 96.38. It is the most intense possible for this yellow and this brightness, as there is no spectrum that could produce this colour more intensely at this brightness.
The broader the maximum wavelength range is, the brighter the extremely possible colour is, until white light is produced in maximum intensity for all wavelength ranges.
Nach Wilhelm Ostwald werden die äußerst-möglichen Farbtöne von sogenannten „Rechteckspektren“ erzeugt: dies sind Spektralverteilungen, bei denen ein mehr oder weniger breiter Wellenlängenbereich die maximale Intensität aufweist und alle anderen Wellenlängenbereiche die Intensität 0. Auch Violett ist einzubeziehen, welches am Anfang und am Ende des sichtbaren Spektrums maximale Intensität aufweist. Rechenbar formuliert: bei Rechteckspektren sind nur minimale (0) oder maximale (1) Intensität sowie maximal 2 Sprungstellen (0/1 oder 1/0) innerhalb des sichtbaren Wellenlängenbereichs der Fall.
If this rule is applied to the 10-nanometre step size in the range 400-700 nanometres, which is common for colour measuring instruments, 962 rectangular spectra are obtained. These colours form the outer shell of the CIELAB colour space, all other colours lie in the inner area. Lab coordinates that lie outside the body spanned in this way are not colours, but purely theoretical computational variables that have no counterpart in the real world because they cannot be generated with any light spectrum.

(H. Everding CC-BY-SA 4.0)

Software Lab colour input and CIELAB colour space
The usual limits for a and b (-128...127) in software are exceeded in reality in several areas of the rectangular spectra. The outermost conceivable green, for example, has an a-value of -164. It is similar in the yellow range (bmax=146). In other words: not all shades of green and yellow can be reproduced by Lab colour value in software.
Gravierender ist der Umstand, dass man in Lab-fähigen Softwares mit Farbwerten arbeiten kann, die außerhalb der CIELAB-Farbraum-Grenzen liegen. Diese werden sogar farbig angezeigt, was völlig unsinnig und verwirrend ist. Ein Beispiel: Für die Koordinaten (Lab 0 100 100) zeigt Software eine dunkelrote Voransicht. Schon der gesunde Menschenverstand besagt aber, dass bei einer Helligkeit 0 kein Farbton außer Schwarz vorliegen kann: „Nachts sind alle Katzen grau“. Dies wird durch die Rechteckspektren bestätigt: Die einzige Farbe der Helligkeit 0 ist die, bei der kein Wellenlängenbereich eine Intensität aufweist, bei ihr ist a=0 und b=0.

So there is a double need for development of Lab colours in software. Above all, an algorithm would be important that, similar to the gamut calculations, returns any colour value to the outer limit of the CIELAB colour space if required, but at least does not display such colour values as a colour.
List of rectangular spectra
The file cielab-boundaries contains the Lab coordinates of the rectangular colours at 10nm measuring interval under the following conditions:
- 2° observer angle, illuminant D50 (common in pre-press)
- 10° observer angle, illuminant D65 (usual for paint colours)
- 2° observer angle, illuminant D65 (sRGB parameters)
You can open the clf files in a text editor, or save them in the Digital colour atlas where the CIELAB colour space is then displayed in 3D in a freely navigable way. There you can also see at a glance that the real colour space is only about 60% of the CIELAB coordinate space.
Author: Holger Everding
